Book summary
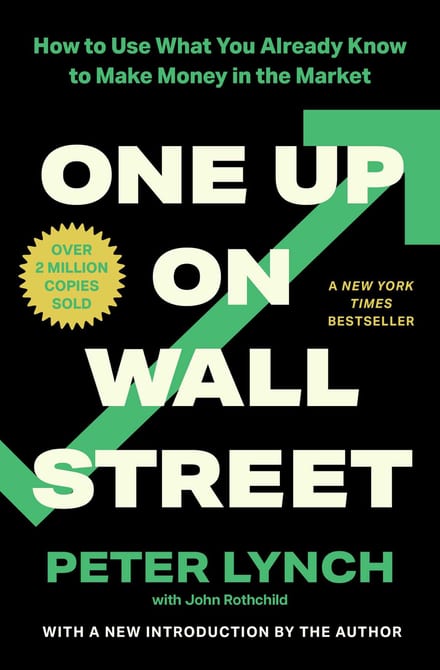
One Up on Wall Street: How to Use What You Already Know to Make Money in the Market
How to Use What You Already Know to Make Money in the Market
The full book runs ~318 pages — roughly 6 hours of reading. You get the key ideas here in 5 minutes.
The key ideas
- Spot businesses as a customer, months before an analyst writes them up.
- Check size first: a company earning billions cannot grow those numbers quickly.
- Sort every stock into six kinds, because each one pays out differently.
- Track earnings and treat the share price as the least useful number going.
- Ask which inning the story is in — 10 percent coverage beats 90.
- Accept the tension: Bogle's arithmetic says most pickers trail the index anyway.
The summary
The professionals are not hiding anything from you. That’s the claim underneath everything in this book, and Peter Lynch earned the right to make it. He ran Fidelity’s Magellan Fund from May 1977 to May 1990, and Fidelity’s own records show it going from $20 million in assets to the $14 billion his successor inherited; a thousand dollars left in the fund across those thirteen years came out as twenty-eight thousand. His account of how is deflating. No macro forecast, no model — he looked at more companies than anyone else was willing to, and found a good many of the best ones the way you would, as a customer in a store.
Your edge is wherever you already stand
Count the people who watch a successful company up close: its employees, its suppliers, the contractors building its new stores, the customers in the queue. All of them see the business working months before it reaches an analyst’s note, and Lynch’s complaint is that they trade the knowledge away. The doctors prescribing a new ulcer drug were, he suspected, fully invested in oil stocks while the oil executives bought drug issues — each group spending its edge in the other’s field.
His own best example arrived in a grocery bag. His wife Carolyn brought home a pair of L’eggs pantyhose from a test market and said they were good. He did the work: women went to the supermarket weekly and a department store every six weeks, and all the decent hosiery was being sold in the wrong place. Hanes became his largest position. When a rival landed on the same rack, he bought 48 pairs and handed them round the office; the verdict came back in a fortnight — not as good — so he held on. He called that fundamental research, and he meant it literally.
The line everyone quotes and the sentence they skip
Writing a new introduction eleven years on, Lynch was tired enough of being misread to print a disclaimer. Liking a store, a product or a restaurant is a good reason to put a company on your research list. It is not a reason to own it. A busy Dunkin’ Donuts is an anonymous tip shoved through the letterbox — intriguing, unverified, worth nothing until you’ve checked earnings prospects, financial condition and competitive position.
Two of those checks do most of the work. The first is size: a company already worth $39 billion and earning $3 billion a year, as General Electric was, can’t grow those numbers quickly, however good its products. The second is which inning the story is in — a retailer with stores in 10 percent of the country is a different proposition from the same retailer at 90 percent, and the share price rarely tells them apart. Beyond that he tracked one number, earnings. The stock price he thought the least useful information anyone follows, and the most followed.
Six kinds of story
Judging a company starts with knowing what kind it is, because each kind pays out differently:
- Slow growers — large, aging, flat. You own them for the dividend.
- Stalwarts — multibillion-dollar hulks compounding earnings around 10 to 12 percent. Lynch took a 30 to 50 percent gain and moved on, keeping a few as ballast through slumps.
- Fast growers — small and aggressive, growing 20 to 25 percent a year. Where the tenbaggers live, and best of all in a slow industry.
- Cyclicals — autos, airlines, steel. The most misunderstood, because they look like stalwarts and can halve if you buy at the wrong point in the cycle.
- Turnarounds — battered companies that rebound fast if they survive, largely detached from the market.
- Asset plays — something valuable on the books that the market hasn’t priced in.
The categories aren’t a filing system, they’re a set of expectations: you don’t hold a stalwart waiting for a tenfold gain. Companies migrate, too — a fast grower runs out of room, becomes a stalwart, and ends up a candidate for a turnaround.
The tension he doesn’t resolve
None of this survives contact with The Little Book of Common Sense Investing intact. Bogle’s arithmetic says investors as a group earn the market’s return minus costs, so the average stock-picker must trail it — and Lynch half-concedes it. Writing at the end of the nineties, he noted that money had poured into mutual funds through the greatest bull market on record and drew the obvious conclusion: if amateurs had done well picking their own stocks, they wouldn’t have migrated. Their method must be flawed. His reply isn’t that stock-picking is easy, only that it’s work, and that most people do more homework on a refrigerator than on a $10,000 position.
Where the two camps stop arguing is temperament. From 1965 to 1995, by Lynch’s arithmetic, a saint who bought at the low of every single year compounded at 11.7 percent; the unluckiest soul alive, buying at the high thirty years running, got 10.6. Three decades of perfect timing bought about a point a year. Declines are the entry fee — 53 drops of 10 percent or more in 95 years, 15 of them 25 percent or worse — which is why he said the key organ in this business is the stomach, not the brain.
The bottom line
The market rewards people who understand what they own, and that understanding is open to anyone willing to do the reading — but the reading is the whole thing, not the noticing. Lynch’s examples are period pieces now and were never the point; the method was, and the method is checking a hunch until it becomes a case. Read it if you intend to pick individual stocks and want an honest account of the work involved. If you’d rather skip that work, the book’s own logic hands you back to an index fund.
Fact check
Popular books repeat findings that later research has complicated. Where One Up on Wall Street makes a testable claim, here's what the evidence actually shows.
Lynch took Fidelity's Magellan Fund from $20 million in May 1977 to $14 billion in May 1990, and $1,000 left in the fund across those thirteen years came out as $28,000.
Lynch gives exactly these figures himself, and gives them consistently: in his 1997 PBS Frontline interview he states $20 million in May 1977, $14 billion when he left, and $1,000 becoming $28,000 by May 31, 1990. That implies 29.2 percent a year, against 15.1 percent for the S&P 500 with dividends reinvested over the same thirteen years — the same $1,000 in the index would have been about $6,200. Two caveats: the $18 million starting figure repeated across most finance sites is not Lynch's own number, and 29.2 percent is the fund's return rather than the average shareholder's, since most of the $14 billion arrived in the final years and dollar-weighted investor returns run systematically below buy-and-hold returns in nearly every major market.
- Lynch P. Interview with Peter Lynch. PBS Frontline, "Betting on the Market" (1997). Source
- Shiller RJ. Online Data: U.S. Stock Markets 1871-Present — monthly S&P Composite price, dividend and earnings series (monthly averages of daily closing prices). Yale University. Source
- Dichev ID. What are stock investors' actual historical returns? Evidence from dollar-weighted returns. Am Econ Rev. 2007;97(1):386-401. Source
Ordinary people hold an edge over Wall Street because they see good businesses working first — as customers, employees, suppliers and neighbours — long before an analyst does.
The familiarity edge is real and it is small. Ivkovic and Weisbenner tracked discount-brokerage households from 1991 to 1996 and found the average one earned 3.2 percentage points more a year on stocks headquartered near home than on its distant holdings. Barber and Odean, working the same period and the same kind of data across 66,465 households, found those households' gross stock picks roughly matched the market — 18.2 percent in aggregate against 17.9 percent for a value-weighted NYSE/AMEX/Nasdaq index — and then handed the difference to commissions and spreads: net, the average household earned 16.4 percent and the households that traded most earned 11.4 percent. That fits the qualifier Lynch himself insists on — the noticing is worth something, and acting on it too often is what consumes the gain.
- Ivkovic Z, Weisbenner S. Local does as local is: information content of the geography of individual investors' common stock investments. J Finance. 2005;60(1):267-306. Source
- Barber BM, Odean T. Trading is hazardous to your wealth: the common stock investment performance of individual investors. J Finance. 2000;55(2):773-806. Source
Timing hardly matters: between 1965 and 1995, buying at every year's low compounded at 11.7 percent a year and buying at every year's high still returned 10.6 percent.
Rebuilding the exercise from Shiller's monthly S&P Composite series with dividends reinvested — $1,000 invested in each year from 1965 to 1994 and held to the end of 1994 — the perfect-timing investor compounds at 11.7 percent and the worst-timing investor at 10.9 percent. Lynch's 10.6 sits a little lower because monthly averages understate a year's true high, but his conclusion survives: three decades of flawless timing were worth about one percentage point a year. The companion figure holds up too — the same series shows 13 declines of 25 percent or more between 1901 and 1995 against Lynch's 15, and 38 of 10 percent or more against his 53, with monthly data missing the short sharp drops that a daily series would catch. What the arithmetic does not cover is the investor who sits in cash waiting; both of Lynch's investors buy every single year.
- Shiller RJ. Online Data: U.S. Stock Markets 1871-Present — monthly S&P Composite price, dividend and earnings series (monthly averages of daily closing prices). Yale University. Source
Small, fast-growing companies are where the ten-baggers live, so that is the category an individual investor should hunt in.
Ten-baggers do come disproportionately from small companies, but the category as a whole has been the worst corner of the US market to hold money in. In Kenneth French's CRSP-built portfolios, small-cap growth stocks — the standing academic proxy closest to Lynch's fast growers — returned 8.5 percent a year from 1926 to 1989 and 5.5 percent from 1990 to 2025, against 10.0 and 10.9 percent for the market. Small-cap value, nearer to Lynch's turnarounds and asset plays, returned 19.1 and 15.4 percent across the same two stretches. The proxy is imperfect, since French sorts on book-to-market rather than earnings growth, but the direction has been the same for a century: the winners in this category are spectacular and the average member of it is not.
- French KR. Data Library: 6 Portfolios Formed on Size and Book-to-Market (2x3), value-weighted monthly returns from July 1926, built from CRSP data. Tuck School of Business, Dartmouth College. Source
Frequently asked questions
What is One Up on Wall Street about?
The professionals aren't hiding anything from you. Peter Lynch ran Fidelity's Magellan Fund from May 1977 to May 1990, taking it from $20 million in assets to the $14 billion his successor inherited, and his account of how is deflating: no macro forecast and no model, just looking at more companies than anyone else was willing to, and finding many of the best ones the way a customer in a store would.
What are the key takeaways from One Up on Wall Street?
Your edge is wherever you already stand — employees, suppliers, contractors and customers see a business working months before it reaches an analyst's note, and most of them trade that knowledge away for stocks in someone else's field. Lynch's own example was his wife bringing home a pair of L'eggs from a test market, after which he did the work and made Hanes his largest position. That homework clause is the sentence everyone skips: liking a store or a product puts a company on your research list, not in your portfolio, until you've checked earnings prospects, financial condition and competitive position. Two checks do most of the work — size, since a company already worth $39 billion can't grow quickly however good its products, and which inning the story is in, because a retailer with stores in 10 percent of the country is a different proposition from the same retailer at 90 percent. He tracked earnings and thought the share price the least useful widely followed number. Companies sort into six kinds, each with different expectations: slow growers, stalwarts, fast growers, cyclicals, turnarounds and asset plays. And temperament beats timing — from 1965 to 1995, buying at every year's low compounded at 11.7 percent against 10.6 percent for buying at every high, which is why he said the key organ in this business is the stomach, not the brain.
Who should read One Up on Wall Street?
Read it if you intend to pick individual stocks and want an honest account of the work that involves.
Is One Up on Wall Street worth reading?
The method holds up better than the material: the companies Lynch uses are period pieces now, and the categories matter less than the discipline of checking a hunch until it becomes a case. The larger caveat is one the book half-concedes — Bogle's arithmetic says investors as a group earn the market's return minus costs, so the average stock-picker must trail it, and Lynch's reply is only that picking stocks is work rather than easy. If you'd rather not do that reading, the book's own logic hands you back to an index fund.