Book summary
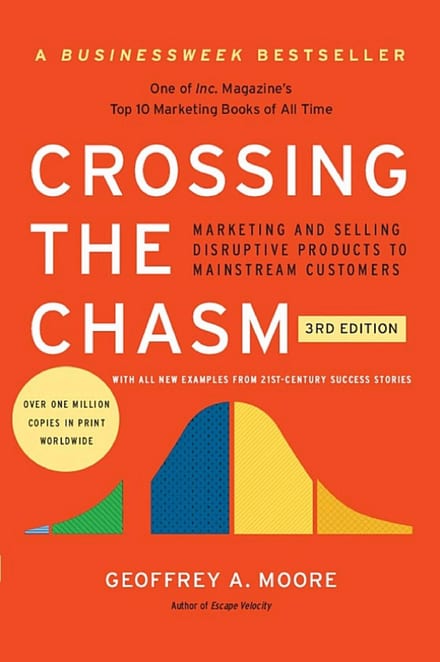
Crossing the Chasm: Marketing and Selling Disruptive Products to Mainstream Customers
Marketing and Selling Disruptive Products to Mainstream Customers
The full book runs ~288 pages — roughly 5 hours of reading. You get the key ideas here in 5 minutes.
The key ideas
- Treat early adopters and pragmatists as separate markets that buy for different reasons.
- Get the references pragmatists accept — peers in their own industry, never visionaries.
- Shrink the target: take one beachhead, big enough to matter, small enough to lead.
- Sell the whole product — integration, training, services — most of it assembled from partners.
- Expand down the bowling alley: each segment you own becomes the reference for the next.
- Hold the model loosely — it's a practitioner's picture, not a finding backed by data.
The summary
The adoption curve everyone draws is smooth. Innovators buy first, early adopters follow, the majority arrives, the money shows up. Geoffrey Moore’s argument is that the curve has a break in it — a gap between the enthusiasts who bought early and the pragmatic buyers who make a market worth having. Products fall into it with good press, real customers, a working demo — and never climb out. He called it the chasm, and the book is about why it opens and how to get across.
The curve is borrowed, and Moore bent it
The underlying model isn’t his. It comes from Everett Rogers, who published Diffusion of Innovations in 1962, drawing on rural-sociology work at Iowa State — most famously Bryce Ryan and Neal Gross’s 1943 study of how hybrid seed corn spread through two Iowa farming communities. What it surfaced was social rather than economic — though the split is finer than the retelling suggests. Salesmen were how most farmers first heard of the seed; neighbours were who most influenced them to actually plant it, and that pattern reversed with timing, with the earliest adopters crediting salesmen and the latest crediting neighbours.
Rogers sorted adopters into five groups by how early they move, cutting the curve at standard deviations from the average adoption date — so the shares below are arithmetic from an assumed normal distribution, not a count of real buyers:
- Innovators — the first 2.5%
- Early adopters — the next 13.5%
- Early majority — the next 34%
- Late majority — the next 34%
- Laggards — the final 16%
Moore kept the shape, recast the groups for the technology market — enthusiasts, visionaries, pragmatists, conservatives, skeptics — and then did the thing that made the book: he drew gaps between them, one of them enormous.
The gap is between two kinds of buyer, not two kinds of product
Moore’s account is that when something genuinely disruptive shows up, a community doesn’t respond as one market. It self-segregates by how people decide. The people who buy early — the technology enthusiasts who want to see how it works, the visionaries who want to change how their business runs — trust their own judgment. They will tolerate a half-built product because what they are buying is a change agent, and they will meet you halfway.
The early majority won’t. Pragmatists are buying a productivity improvement, not a revolution, and they decide by asking people like themselves. There’s the trap. The references a pragmatist wants have to come from other pragmatists doing the same job in the same industry — and the only references you have are visionaries, whose entire appeal was that they were nothing like the mainstream. Early customers meet you halfway; as Moore puts it in interviews, pragmatists have to be met entirely on their own turf. That asymmetry, in his telling, is what the chasm actually is.
Shrink the target market until you can own it
The advice that follows sounds backwards. Facing a stalled business, you narrow rather than broaden: pick one segment — a beachhead — and take all of it.
Moore’s test for choosing one is compact: “big enough to matter, small enough to lead,” and a good fit with what you’re already best at. Aim at pragmatists in pain — buyers with a use case conventional tools genuinely cannot handle, under enough pressure that a new vendor looks less risky than another quarter like the last one.
The military metaphor runs through the strategy, and the book’s own chapters carry it: target the point of attack, assemble the invasion force. The D-Day logic is that the Allies didn’t invade the whole French coast. They took one stretch of beach completely, then moved inland. A thin presence across a broad market buys nothing; dominance of one narrow segment makes you the obvious choice inside it, and word of mouth starts working for you instead of against you.
A related warning: don’t buy your way across with discounts. Cutting price doesn’t reduce the pragmatist’s real risk — that the thing won’t work — and it costs you the margin you need to make it work.
The whole product, then the next lane
Pragmatists don’t buy technology, they buy an outcome that already functions. Moore’s whole product is everything the customer needs to fulfil their reason to buy — and nothing more. Core product, plus the services, integration, training and partner pieces that make it work. Most of that you assemble rather than build, which is why the strategy leans so hard on alliances.
Expansion after that is sequential, not broad. The bowling alley: nail one use case in one segment, then use those customers as credible references for an adjacent one — a neighbouring process owner for whom your first sponsor is a believable peer. Each pin knocks over the next.
What the model is and isn’t
It’s a 1991 book, and it shows. The examples come from the enterprise hardware and packaged-software era, and Moore has been open that the framework maps to business buyers better than consumer ones — he added a separate model, the Four Gears, for consumer adoption in the 2014 third edition, while maintaining the core life cycle still holds.
The sharper objection is about evidence: Moore is writing a practitioner’s manual, not a study, and there are memorable examples but no data behind them. The marketing academic Neil Bendle goes further, arguing the model contradicts its own picture: if the adopter groups really are separate populations that reference each other, you’d expect a series of bell curves with valleys between all of them, not one dramatic gap in a single smooth curve. Worth holding onto — the chasm is a way of seeing a problem, not a measured finding.
The bottom line
If your product has early fans and stalled revenue, Moore’s diagnosis is that you don’t have a product problem, you have a reference problem — and the only cure is to pick one narrow segment of pragmatic buyers and dominate it completely before you go anywhere else. It’s the rare strategy book whose central instruction is to want less market, not more. Read it if you’re selling something new to businesses and can’t work out why the enthusiasm isn’t converting.
Fact check
Popular books repeat findings that later research has complicated. Where Crossing the Chasm makes a testable claim, here's what the evidence actually shows.
The adoption curve has a real break in it — a chasm between the early adopters who buy first and the mainstream early majority — that products fall into and fail to climb out of.
A discontinuity of this shape has been measured, and it has a name in the literature: the saddle, a sharp drop in sales after takeoff followed by an eventual recovery. Chandrasekaran and Tellis tracked 10 products across 19 countries and found the saddle beginning in 148 product-country combinations, on average 9 years after takeoff at about 30% penetration, with sales falling 29% at the trough. But the chasm explanation only won for information and entertainment products; for kitchen and laundry goods the saddle tracked economic contractions instead, so the discontinuity is not a universal law of new markets. It is also shrinking — replicating the original consumer-electronics analysis on 2021 data, Appel and Muller found saddles in 29% of 48 products against 50% of the earlier 32, and lasting 2.4 years rather than 3.9.
Rogers' five adopter groups split a market into fixed shares: 2.5% innovators, 13.5% early adopters, 34% early majority, 34% late majority, 16% laggards.
Those percentages are a definition rather than a measurement. Rogers assumed adoption times follow a normal distribution and cut the curve at standard deviations from the mean adoption date — innovators are whoever is more than two standard deviations early, which is 2.5% of a normal curve by arithmetic alone, before anyone counts a customer. When the same categories are estimated from real sales instead of assumed, the shares land elsewhere: across 86 consumer-electronics products, Appel and Muller put innovators plus early adopters at 17-21% (Rogers gives 16%), each majority at 29-30% (Rogers gives 34%) and laggards at 21-22% (Rogers gives 16%). The five groups are a useful vocabulary; the specific numbers are an artefact of the assumed curve.
- Sahin I. Detailed review of Rogers' diffusion of innovations theory and educational technology-related studies based on Rogers' theory. Turkish Online Journal of Educational Technology. 2006;5(2):Article 3. Source
- Appel G, Muller E. Adoption patterns over time: a replication. Marketing Letters. 2021;32(4):499-511. Source
The founding diffusion study — Ryan and Gross's 1943 research on hybrid seed corn in two Iowa communities — found that farmers judged the new seed mainly through the opinions of neighbours they trusted.
The full Iowa State bulletin reporting that survey separates two things the retelling merges. Salesmen were how most farmers first heard of hybrid seed — nearly half named a salesman as their original source, and 70% first learned of it through commercial channels including farm journals. Neighbours mattered at the decision: asked who most influenced them to actually plant it, 45.5% of the 257 farmers said neighbours, against 32.0% who said salesmen. And the split runs by timing rather than by type of person — two-thirds of the earliest adopters credited salesmen with influencing them most, while two-thirds of the latest adopters credited neighbours.
- Ryan B, Gross N. Acceptance and Diffusion of Hybrid Corn Seed in Two Iowa Communities. Research Bulletin 372. Ames: Agricultural Experiment Station, Iowa State College; 1950. Source
Frequently asked questions
What is Crossing the Chasm about?
The technology adoption curve is usually drawn as a smooth run from innovators through to laggards. Geoffrey Moore's claim is that there's a break in it — a gap between the enthusiasts and visionaries who buy early and the pragmatic buyers who make a market worth having. Products fall into that gap with good press, real customers and a working demo, and never climb out; the book is about why it opens and how to get across.
What are the key takeaways from Crossing the Chasm?
The chasm is a difference between kinds of buyer, not kinds of product: visionaries trust their own judgment and will meet a half-built product halfway, while pragmatists decide by asking people like themselves — so your visionary customers are worthless as references. The fix is counterintuitive: narrow rather than broaden. Pick one beachhead segment, "big enough to matter, small enough to lead," aim at pragmatists whose problem conventional tools genuinely can't handle, and take all of it. Ship the whole product — the services, integration, training and partner pieces that make the outcome work — and expand one adjacent segment at a time, the bowling alley. Don't try to discount your way across; price cuts don't reduce the pragmatist's real risk that the thing won't work.
Who should read Crossing the Chasm?
It's for founders, marketers and sales leaders selling something new to businesses who can't work out why early enthusiasm isn't converting into revenue.
Is Crossing the Chasm worth reading?
The core diagnosis is still one of the most useful ideas in B2B strategy, and it's the rare book whose central instruction is to want less market, not more. It's from 1991 and shows it — the examples come from the enterprise hardware and packaged-software era, and Moore has acknowledged the framework fits business buyers better than consumer ones, adding a separate model for consumer adoption in the 2014 edition. It's also a practitioner's manual with memorable examples and no data behind them; the marketing academic Neil Bendle argues that separate adopter populations should produce several gaps rather than one dramatic one. Treat the chasm as a way of seeing a problem rather than a measured finding.